2019: Volume 1, Issue 1
Past Issues
 Abstract
  PDF
PDFOutside Facility Transfer Is Associated With Frequent Disposition to Rehabilitation Following Transcatheter Aortic Valve Replacement
Sameer A Hirji# , Rohan M Shah# , Lily Saadat, Laura Piechura, Sary Aranki, Hari R Mallidi, Mark P Pelletier, Prem S Shekar, Tsuyoshi Kaneko*
Division of Cardiac Surgery, Brigham and Women’s Hospital; Harvard Medical School, Boston, MA, USA
*Corresponding author: Tsuyoshi Kaneko, Division of Cardiac Surgery, Brigham and Women’s Hospital, 15 Francis St, Boston MA, 02115, USA.
# Hirji SA, Shah RM contributed equally.
Received: November 11, 2019 Published: November 28, 2019
ABSTRACT
Introduction: Significant variability exists in disposition practices to non-home facilities following transcatheter aortic valve replacement (TAVR). Increased spending due to Post Acute Care Transfer (PACT) policies has led hospitals to scrutinize patient disposition following hospital discharge. We sought to examine the impact of admission origin on rehabilitative services use following TAVR.
Methods: The National Inpatient Sample was queried for TAVR procedures between 2012-2014. We further isolated patients who were discharged to a rehabilitation facility (skilled nursing facility, intermediate care facility, or other rehabilitation facility) stratified by admission origin. Multivariable logistic regression was used to determine independent predictors for disposition to a rehabilitation facility.
Results: A total of 12,175 TAVR patients were discharged to rehabilitation facilities. This included 10,520 patients (86.4%) who were admitted from home, 1,255 patients (10.3%) who were transferred from an acute care hospital, and 355 patients (2.9%) who were transferred from another health facility at the time of admission. Patients transferred from an acute hospital had higher inpatient costs ($77,092 vs. $66,507 and $64,861) and longer length of stay (17.2 vs. 11.6 and 10.6 days; all p < 0.05) compared to those transferred from a non-acute facility and those not transferred, respectively. Weekend admission (odds ratio [OR]= 1.78, 95% confidence interval [CI]: 1.11 to 2.84; p=0.017), non-elective admission (OR= 8.23, 95% CI: 4.15 to 13.16; p<0.001), and transfer from a non-acute facility (OR 4.32, 95% CI: 1.74 to 10.67; p=0.002) were independent predictors for disposition to a rehabilitation facility.
Conclusions: Admission origin appears to impact the likelihood of requiring rehabilitation services following TAVR, independent of academic status and patient comorbidities. Drivers propagating non-home discharge, such as weekend transfers from non-acute facilities and non-elective cases, should be investigated to optimize hospital resource utilization under current PACT policies.
Keywords: Transcatheter Aortic Valve Replacement; Post-Acute Care Transfer; Aortic Valve Treatment; Surgical Aortic Valve Replacement.
INTRODUCTION
Transcatheter aortic valve replacement (TAVR) has emerged as an established treatment option for the management of symptomatic severe aortic stenosis in in-operable, highrisk, and intermediate-risk patients [1-3]. Given the inherent medical complexity of this patient population, unplanned 30- day readmission rates are frequent (ranging from 14-21%) and have been shown to contribute negatively towards patient outcomes and healthcare costs [4-6]. Furthermore, the majority of readmissions after TAVR are often secondary to non-cardiac etiologies, including respiratory failure, infection and bleeding [7].
In light of the significant burden associated with readmissions following TAVR, heightened attention has been focused on analyzing risk factors for readmission at hospital, state and federal levels. In fact, 30-day readmission rates is an established quality performance metric per the Centers for Medicare and Medicaid services (CMS). Consequently, there are several ongoing efforts to develop novel strategies for reducing readmissions [8]. A specific focus involves efforts to increase discharges to home versus rehabilitation facilities such as skilled nursing facilities (SNF), whenever possible.
The implications of discharge destination have been described in prior studies and are significant for both clinical and economic reasons; in particular, discharge to SNF is an independent predictor of 30-day readmission [4]. Moreover, increased spending due to Post Acute Care Transfer (PACT) policies has led hospitals to scrutinize patient disposition following discharge. However, significant variability exists in disposition practices to non-home facilities following TAVR [9,10]. While patient-related and hospital-based risk factors for non-home discharge are established, the impact of origin of admission on ultimate disposition remains unknown, but is relevant in understanding pre-hospital drivers that predict post-TAVR disposition. In this study, we sought to examine the impact of admission origin on use of rehabilitative services following TAVR.
METHODS
Data Source
The National Inpatient Sample (NIS) is derived from the Healthcare Utilization Project and is the largest inpatient, publicly-available, all-payer database based on administrative claims [11]. The repository consists of a 20% sample of de-identified information on patient demographics, comorbidities, in-hospital outcomes including length of stay (LOS), costs, and discharge disposition from approximately 1,000 non-federal hospitals. When nationally weighted, the data represent more than 35 million discharges annually.
Study Population and Outcomes
We retrospectively identified all TAVR discharges using International Classification of Diseases, Ninth Revision, Clinical Modification (ICD-9-CM) procedures codes between 2012- 2014. We further isolated patients who were discharged to a rehabilitation facility (the rehab cohort - SNF, intermediate care facility (ICF) or any other rehabilitative facility) following their TAVR procedure (Supplement Table 1). We excluded all patients who underwent both surgical aortic valve replacement (SAVR) and TAVR during the same hospitalization.
Our primary outcome of interest was disposition tendency to a rehabilitation facility. Secondary outcomes were inpatient costs, LOS and in-hospital outcomes: complete heart block, cardiogenic shock and cardiac arrest. Elixhauser comorbidities, which are a common measure of comprehensive comorbidities for large administrative inpatient databases, were utilized as single categories and as an index to serve indirectly as an indicator for frailty [12,13]. The Charlson Comorbidity Index, which was calculated using ICD-9-CM codes, was used to summarize the comorbidity burden for an individual [14]. Hospital-specific variables such as hospital size, location, teaching status, region and ownership were also queried.
Statistical Methods
Survey procedures were applied to (1) generate national estimates and variances using given probability weights and (2) to account for clustering of outcomes by sampling unit (i.e. hospital) and sampling variation by region and year, as described previously [15,16]. Differences in patient demographics, comorbidities, in-hospital and hospital-level factors between the rehab cohort versus home discharge cohort were compared using univariate analysis. Costs were calculated using hospital charges and cost-to-charge ratios in US dollars [17]. Within the rehab cohort, we further compared preoperative, in-hospital, and hospital-level factors by admission origin. The 3 comparison groups were (1) not transferred (i.e. coming from home) (2) transferred from acute care hospital and (3) transferred from another health facility.
Continuous variables are expressed as a mean with standard deviation and were compared using Generalized Wald tests. Categorical variables are presented as number and percentages and were compared using Chi-squared tests. We also developed a stepwise, backward-selection, multivariable logistic regression model to determine independent predictors for disposition to a rehabilitation facility following TAVR. Covariates with a p-value <0.05 were kept in the model; those that crossed this threshold were manually trimmed in the final iteration of the model until all remaining covariates met the significance level. These results are presented as odds ratios (OR) and 95% confidence intervals (CI). All analyses were conducted using STATA Version 13.1 (StataCorp LP, College Station, TX) survey procedures with an alpha level of p ≤0.05 as the criterion for significance.
RESULTS
Characteristics and Outcomes Stratified by Discharge Disposition
A total of 40,900 patients met inclusion criteria. Of these, 12,175 patients were discharged to a rehabilitation facility (i.e. the rehab cohort; Table 1). The rehab cohort was significantly older, more likely female, and had a higher number of chronic conditions (such as atrial fibrillation, prior pacemaker placement, renal failure) compared to the home discharge cohort (all p <0.001). These patients were also less likely to be admitted electively and more likely to be transferred in preoperatively (13.3% vs. 4.4%; p <0.001). Proportionally, more patients in the rehab cohort underwent the trans-apical TAVR approach (26.6% vs. 14.4%, p <0.01) compared to the home discharge cohort.
In terms of postoperative outcomes, the rehab cohort had a higher incidence of complete heart block, cardiogenic shock and cardiac arrest, and significantly longer inpatient LOS and costs compared to the home discharge cohort (all p <0.01; Table 1). After stratifying the cohort by admission origin, TAVR patients who were transferred from another health facility or an acute care facility had significantly higher proportions of discharges to rehabilitation facilities postoperatively compared to patients not transferred (80.7% and 70.7% vs. 44.5%; all p <0.01; Figure 1)
Table 1: Preoperative Factors, Hospital Characteristics, and In-Hospital Outcomes of TAVR Patients Stratified by Discharge Disposition.
|
Variable |
Home Discharge Cohort (n=13,815) |
Rehab Discharge Cohort (n=12,175) |
P-Value |
|
Demographics |
|||
|
Age |
79.0 (9.8) |
83.3 (6.7) |
<0.01* |
|
Female |
5,210 (37.7) |
7,095 (58.3) |
<0.01* |
|
Race |
0.09 |
||
|
White |
11,140 (86.8) |
9,820 (87.9) |
|
|
Black |
540 (4.2) |
395 (3.5) |
|
|
Hispanic |
530 (4.1) |
350 (3.1) |
|
|
Asian or Pacific Islander |
190 (1.5) |
125 (1.1) |
|
|
Native American |
30 (0.2) |
20 (0.2) |
|
|
Other |
400 (3.1) |
460 (4.1) |
|
|
Median Household Income Quartile, percentile |
<0.01* |
||
|
0-25th |
3,205 (23.7) |
2,400 (20.0) |
|
|
26-50th |
3,610 (26.7) |
2,815 (23.5) |
|
|
51-75th |
3,510 (30.0) |
3,255 (27.2) |
|
|
76-100th |
3200 (23.7) |
3,520 (29.4) |
|
|
Number of Chronic Conditions |
9.00 (2.9) |
9.9 (2.9) |
<0.01* |
|
Comorbidities |
|||
|
Atrial Fibrillation |
5,345 (38.7) |
6,155 (50.6) |
<0.01* |
|
Smoking |
4,405 (31.9) |
2,815 (23.1) |
<0.01* |
|
Prior TIA/Stroke |
10,450 (75.6) |
8,500 (69.8) |
<0.01* |
|
Dyslipidemia |
9,540 (69.1) |
7,240 (59.5) |
<0.01* |
|
Known Coronary Artery Disease |
10,055 (72.8) |
7,920 (65.1) |
<0.01* |
|
Prior Myocardial Infarction |
2,385 (17.3) |
1,660 (13.6) |
<0.01* |
|
Prior CABG |
3,785 (27.4) |
1,990 (16.3) |
<0.01* |
|
Prior PCI |
2,915 (21.1) |
2,085 (17.1) |
<0.01* |
|
Carotid Artery Disease |
1,025 (7.4) |
865 (7.1) |
0.68 |
|
Prior PPM |
1,370 (9.9) |
1,330 (10.9) |
0.26 |
|
Prior ICD |
485 (3.5) |
255 (2.1) |
<0.01* |
|
Alcohol Abuse |
175 (1.3) |
110 (0.9) |
0.21 |
|
Deficiency Anemia |
3,060 (22.2) |
3,495 (28.7) |
<0.01* |
|
Rheumatoid Arthritis/ Collagen Vascular Diseases |
625 (4.5) |
6,65 (5.5) |
0.10 |
|
Chronic Blood Loss Anemia |
150 (1.1) |
180 (1.5) |
0.18 |
|
CHF |
1,650 (11.9) |
1,555 (12.8) |
0.40 |
|
Chronic Pulmonary Disease |
4,385 (31.7) |
4,195 (34.5) |
0.04* |
|
Coagulopathy |
2,500 (18.1) |
3,290 (27.0) |
<0.01* |
|
Depression |
825 (6.0) |
1,075 (8.8) |
<0.01* |
|
Diabetes, Uncomplicated |
4,190 (30.3) |
3,460 (28.4) |
0.14 |
|
Diabetes with Chronic Complications |
765 (5.5) |
775 (6.4) |
0.20 |
|
HTN, Uncomplicated and Complicated |
11,265 (81.6) |
9,440 (77.5) |
<0.01* |
|
Hypothyroidism |
2,720 (19.7) |
2,605 (21.4) |
0.13 |
|
Fluid and Electrolyte Disorders |
2,450 (17.7) |
4,185 (34.4) |
<0.01* |
|
Other Neurological Disorders |
675 (4.9) |
1030 (8.5) |
<0.01* |
|
Obesity |
1,995 (14.4) |
1,720 (14.1) |
0.75 |
|
Peripheral Vascular Disorders |
3,975 (28.8) |
3,545 (29.1) |
0.80 |
|
Psychoses |
110 (0.8) |
320 (2.6) |
<0.01* |
|
Pulmonary Circulation Disorders |
470 (3.4) |
465 (3.8) |
0.42 |
|
Renal Failure |
4,505 (32.6) |
4,705 (38.6) |
<0.01* |
|
Solid Tumor Without Metastasis |
300 (2.2) |
180 (1.5) |
0.05 |
|
Weight Loss |
310 (2.2) |
1030 (8.5) |
<0.01* |
|
Charlson Comorbidity Index |
2.8 (1.8) |
3.0 (1.7) |
<0.01* |
|
Number of Elixhauser Comorbidities |
5.8 (1.9) |
6.5 (2.0) |
<0.01* |
|
Admission Characteristics |
|||
|
Elective Admission |
11,220 (81.3) |
8,545 (70.2) |
<0.01* |
|
Emergency Department use |
310 (2.2) |
685 (5.6) |
<0.01* |
|
Transfer Status |
<0.01* |
||
|
Not transferred in |
13,110 (95.6) |
10,520 (86.7) |
|
|
Transferred from different acute care hospital |
520 (3.8) |
1,255 (10.4) |
|
|
Transferred from another type of health facility |
85 (0.6) |
355 (2.9) |
|
|
Operative Characteristics |
|||
|
Trans-femoral, Trans-aortic or Subclavian approach |
11,845 (85.7) |
8,965 (73.6) |
<0.01* |
|
Trans-apical approach |
1,990 (14.4) |
3,235 (26.6) |
<0.01* |
|
Cardiopulmonary Bypass |
980 (7.1) |
1,040 (8.5) |
0.09 |
|
Percutaneous Cardiopulmonary Bypass |
80 (0.6) |
145 (1.2) |
0.02* |
|
In-Hospital Outcomes |
|||
|
Complete Heart Block |
1,085 (7.9) |
1,435 (11.8) |
<0.01* |
|
Cardiogenic Shock |
160 (1.2) |
480 (3.9) |
<0.01* |
|
Cardiac Arrest |
190 (1.9) |
515 (4.2) |
<0.01* |
|
Length of Stay |
5.3 (4.2) |
11.3 (8.7) |
<0.01* |
|
Cost (US Dollars) |
48,710 (19,881) |
66,246 (35,401) |
<0.01* |
|
Hospital Characteristics |
|||
|
Census Division of Hospital |
<0.01* |
||
|
New England |
255 (1.9) |
790 (6.5) |
|
|
Middle Atlantic |
1,560 (11.3) |
3,005 (24.7) |
|
|
East North Central |
1,865 (13.5) |
1,835 (15.1) |
|
|
West North Central |
1155 (8.4) |
1,015 (8.3) |
|
|
South Atlantic |
2,575 (18.6) |
2,040 (16.8) |
|
|
East South Central |
1225 (8.9) |
820 (6.7) |
|
|
West South Central |
2,005 (14.5) |
790 (6.5) |
|
|
Mountain |
940 (6.8) |
670 (5.5) |
|
|
Pacific |
2,235 (16.2) |
1,210 (9.9) |
|
|
Bed Size of Hospital |
0.37 |
||
|
Small |
770 (5.6) |
585 (4.8) |
|
|
Medium |
2,050 (14.8) |
2,010 (16.5) |
|
|
Large |
10,995 (79.6) |
9,580 (78.7) |
|
|
Location/ Teaching Status of Hospital |
0.87 |
||
|
Rural |
80 (0.6) |
75 (0.6) |
|
|
Urban nonteaching |
1,555 (11.3) |
1300 (10.7) |
|
|
Urban teaching |
12,180 (88.2) |
10800 (88.7) |
|
|
Region of Hospital |
<0.01* |
||
|
Northeast |
1,815 (13.1) |
3795 (31.2) |
|
|
Midwest or North Central |
3,020 (21.9) |
2850 (23.4) |
|
|
South |
5,805 (42.0) |
3650 (30.0) |
|
|
West |
3,175 (23.0) |
1880 (15.4) |
|
|
Control/ Ownership of Hospital |
0.03* |
||
|
Government, nonfederal |
1,320 (9.6) |
930 (7.6) |
|
|
Private, not-profit |
11,220 (81.2) |
10,370 (85.2) |
|
|
Private, invest-own |
1,275 (9.2) |
875 (7.2) |
|
|
Abbreviations: TAVR, transcatheter aortic valve replacement; CABG, coronary artery bypass grafting; PCI, percutaneous coronary intervention; PPM, permanent pacemaker; ICD, implantable cardioverter defibrillator; CHF, congestive heart failure; HTN, hypertension; TIA= transient ischemic attack; AMI, acute myocardial infarction, SNF, skilled nursing facility, ICF, intermediate care facility. Continuous variables are presented as mean (SD) unless otherwise noted as median (IQR); categorical variables are summarized as n (%). *P-value ≤0.05 was considered statistically significant. |
|||
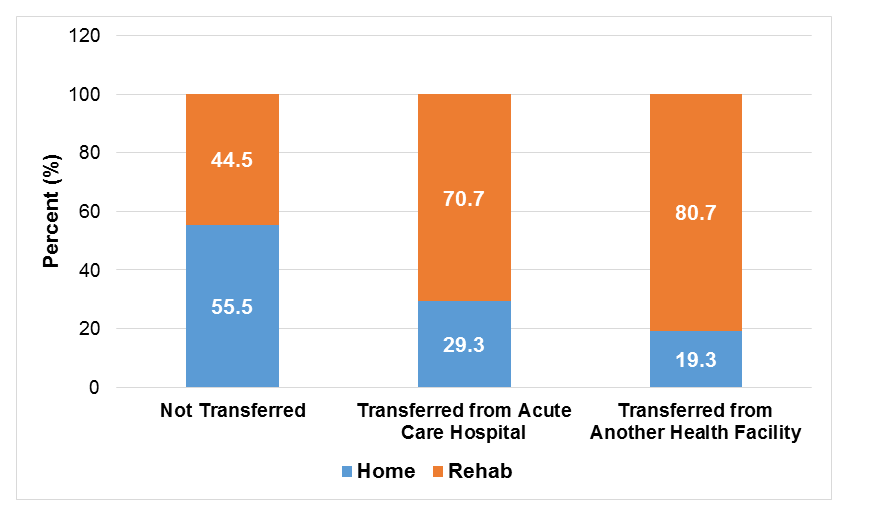
Figure 1: Proportion of Discharges to Rehabilitation Facilities Following TAVR by Preoperative Admission Origin.
Characteristics and Outcomes of Rehab Cohort Stratified By Admission Origin
Of the 12,175 patients in the rehab cohort, 10,520 patients (86.4%) were admitted from home, 1,255 patients (10.3%) were transferred from an acute care hospital, and 355 patients (2.9%) were transferred from another health facility (Table 2). In general, patient age, sex, and comorbidity profile of patients did not vary by admission origin (all p >0.05). But patients who were transferred from an acute care hospital were more likely to be admitted over the weekend compared to patients who were not transferred (17.9% vs 5.4%; global p <0.01).
Although major in-hospital cardiac complications and other hospital-level factors did not vary by admission origin (all p >0.05), patients who were transferred from acute care hospital had significantly longer LOS (17.2 vs 10.6 days and 11.6 days; p <0.01) and higher admission costs ($77,092 vs $64,861 and $66,507; p <0.01) compared to those not transferred and those transferred from another facility, respectively.
Table 2: Preoperative Factors, Hospital Characteristics, and In-Hospital Outcomes of TAVR Rehab Cohort Stratified by Admission Origin.
|
Variable |
Not Transferred (n=10,520) |
Transferred from Acute Care Hospital (n= 1,255) |
Transferred from Another Health Facility (n=355) |
P-Value |
|
Demographics |
||||
|
Age |
83.29 (6.7) |
82.91 (6.7) |
83.27 (7.0) |
0.78 |
|
Female |
6,175 (58.7) |
710 (56.7) |
200 (56.3) |
0.81 |
|
Race |
0.01* |
|||
|
White |
8560 (88.6) |
940 (81.0) |
280 (91.8) |
|
|
Hispanic |
295 (3.1) |
40 (3.5) |
15 (4.9) |
|
|
Median Household Income Quartile for Zip Code |
0.77 |
|||
|
0-25th percentile |
2090 (20.2) |
230 (18.6) |
70 (20.3) |
|
|
26-50th percentile |
2415 (23.3) |
320 (25.9) |
65 (18.8) |
|
|
51-75th percentile |
2850 (27.5) |
300 (24.3) |
85 (24.6) |
|
|
76-100th percentile |
3010 (29.0) |
385 (31.2) |
125 (36.2) |
|
|
Patient Location |
0.04* |
|||
|
"Central" counties of metro areas >= 1 million population |
2820 (26.9) |
255 (20.4) |
110 (31.0) |
|
|
"Fringe" counties of metro areas >= 1 million population |
3000 (28.7) |
440 (35.2) |
105 (29.6) |
|
|
Counties in metro areas of 250,000-999,999 population |
2155 (20.6) |
185 (14.8) |
75 (21.1) |
|
|
Counties in metro areas of 50,000-249,999 population |
855 (8.2) |
70 (5.6) |
15 (4.2) |
|
|
Micropolitan counties |
950 (9.1) |
165 (13.2) |
25 (7.0) |
|
|
Not metropolitan or micropolitan counties |
690 (6.6) |
135 (10.8) |
25 (7.0) |
|
|
Comorbidities |
||||
|
Atrial Fibrillation |
5315 (50.5) |
605 (48.2) |
210 (59.2) |
0.34 |
|
Deficiency Anemia |
2870 (27.3) |
490 (39.0) |
115 (32.4) |
<0.01* |
|
Congestive Heart Failure |
1280 (12.2) |
205 (16.3) |
55 (15.5) |
0.14 |
|
Chronic Pulmonary Disease |
3605 (34.3) |
460 (36.7) |
120 (33.8) |
0.77 |
|
Coagulopathy |
2945 (28.0) |
255 (20.3) |
70 (19.7) |
0.02 |
|
Depression |
950 (9.0) |
100 (8.0) |
25 (7.0) |
0.71 |
|
Diabetes, Uncomplicated |
3020 (28.7) |
325 (25.9) |
110 (31.0) |
0.68 |
|
Diabetes with Chronic Complications |
680 (6.5) |
85 (6.8) |
10 (2.8) |
0.56 |
|
HTN, Uncomplicated and Complicated |
8250 (78.4) |
895 (71.3) |
255 (71.9) |
0.05 |
|
Fluid and Electrolyte Disorders |
3600 (34.2) |
445 (35.5) |
105 (29.6) |
0.70 |
|
Neurological Disorders |
880 (8.4) |
100 (8.0) |
45 (12.7) |
0.45 |
|
Obesity |
1475 (14.0) |
195 (15.5) |
45 (12.7) |
0.79 |
|
Peripheral Vascular Disorders |
3150 (29.9) |
305 (24.3) |
75 (21.1) |
0.13 |
|
Renal Failure |
3915 (37.2) |
635 (50.6) |
125 (35.2) |
0.01* |
|
Smoking |
2460 (23.4) |
270 (21.5) |
75 (21.1) |
0.76 |
|
Prior TIA/Stroke |
1535 (14.6) |
170 (13.6) |
60 (16.9) |
0.79 |
|
Dyslipidemia |
6325 (60.1) |
680 (54.2) |
200 (56.3) |
0.26 |
|
Known Coronary Artery Disease |
6675 (63.5) |
880 (70.1) |
245 (69.0) |
0.13 |
|
Prior Myocardial Infarction |
1255 (11.9) |
130 (10.4) |
45 (12.7) |
0.84 |
|
Prior CABG |
1740 (16.5) |
155 (12.4) |
80 (22.5) |
0.14 |
|
Prior PCI |
1790 (17.0) |
195 (15.5) |
90 (25.4) |
0.25 |
|
Carotid Artery Disease |
770 (7.3) |
70 (5.6) |
15 (4.2) |
0.57 |
|
Prior PPM |
1105 (10.5) |
180 (14.3) |
35 (9.9) |
0.30 |
|
Prior ICD |
205 (2.0) |
35 (2.8) |
15 (4.2) |
0.42 |
|
Number of Chronic Conditions |
9.8 ± 0.1 |
10.3 ± 0.2 |
9.5 ± 0.4 |
0.10 |
|
In-Hospital Outcomes |
||||
|
Complete Heart Block |
1250 (11.9) |
140 (11.2) |
40 (11.3) |
0.96 |
|
Cardiogenic Shock |
385 (3.7) |
85 (6.8) |
10 (2.8) |
0.13 |
|
Length of Stay |
10.60 (8.1) |
17.16 (10.8) |
11.63 (8.9) |
<0.01* |
|
Cost (USD $) |
64,861 (35,109) |
77,092 (36,956) |
66,508 (28,607) |
<0.01* |
|
Admission and Hospital Factors |
||||
|
Weekend Admission |
570 (5.4) |
225 (17.9) |
55 (15.5) |
<0.01* |
|
Elective Admission |
8115 (77.1) |
205 (16.3) |
200 (56.3) |
<0.01* |
|
Bed Size of Hospital |
0.21 |
|||
|
Small |
505 (4.8) |
35 (2.8) |
40 (11.3) |
|
|
Medium |
1705 (16.2) |
230 (18.3) |
55 (15.5) |
|
|
Large |
8310 (79.0) |
990 (79.0) |
260 (73.2) |
|
|
Location/ Teaching Status of Hospital |
0.11 |
|||
|
Urban nonteaching |
1180 (11.2) |
80 (6.4) |
30 (8.5) |
|
|
Urban teaching |
9265 (88.1) |
1175 (93.6) |
325 (91.6) |
|
|
Region of Hospital |
0.14 |
|||
|
Northeast |
3195 (30.4) |
470 (37.5) |
130 (36.6) |
|
|
Midwest or North Central |
2530 (24.1) |
220 (17.5) |
95 (26.8) |
|
|
South |
3135 (29.8) |
415 (33.1) |
60 (16.9) |
|
|
West |
1660 (15.8) |
150 (12.0) |
70 (19.7) |
|
|
Control/ Ownership of Hospital |
0.02* |
|||
|
Government, nonfederal |
840 (8.0) |
70 (5.6) |
15 (4.2) |
|
|
Private, not-profit |
8920 (84.8) |
1130 (90.0) |
285 (80.3) |
|
|
Private, invest-own |
760 (7.2) |
55 (4.4) |
55 (15.5) |
|
|
Abbreviations: TAVR, transcatheter aortic valve replacement; CABG, coronary artery bypass grafting; PCI, percutaneous coronary intervention; PPM, permanent pacemaker; ICD, implantable cardioverter defibrillator; CHF, congestive heart failure; HTN, hypertension; TIA= transient ischemic attack; AMI, acute myocardial infarction, SNF, skilled nursing facility, ICF, intermediate care facility. Continuous variables are presented as mean (SD) unless otherwise noted as median (IQR); categorical variables are summarized as n (%). *P-value ≤ 0.05 was considered statistically significant. |
||||
Predictors of Disposition to a Rehabilitation Facility
In our final multivariable regression model, admission day on weekend (OR 1.78, 95% CI: 1.11 to 2.84), non-elective admission (OR 8.23, 95% CI: 4.15 to 13.16) and patient residency/occupancy in a micropolitan county (OR 2.57, 95% CI: 1.41 to 4.65), were independent predictors of disposition to a rehabilitation facility (all p <0.05; Table 3). Most notably, transfer from another type of health care facility was also found to be associated with increased risk for disposition to a rehabilitation facility after discharge (OR 4.32, 95% CI: 1.75 to 10.67). However, hospital academic status, patient comorbidities and transfer from an acute care facility did not impact the likelihood of discharge to a rehabilitation facility after TAVR.
Table 3: Independent Predictors for Postoperative Disposition to a Rehabilitation Facility Following TAVR.
|
Variable |
Odds ratio |
95% Confidence Interval |
P-Value |
|
|
Admission Day on Weekend |
1.78 |
1.11 |
2.84 |
0.02* |
|
Non-Elective |
8.23 |
4.15 |
13.16 |
<0.01* |
|
Length of Stay |
1.04 |
1.02 |
1.07 |
0.01* |
|
Patient Location: “Central” counties of metro areas³ 1 million population |
[reference] |
|||
|
Patient Location: Micropolitan County |
2.57 |
1.41 |
4.65 |
<0.01* |
|
Patient not transferred |
[reference] |
|||
|
Transfer from another health facility |
4.32 |
1.75 |
10.67 |
<0.01* |
|
*P-value ≤ 0.05 was considered statistically significant. |
||||
DISCUSSION
To our knowledge, no prior study has analyzed the impact of preadmission patient location/origin on the risk of requiring post-procedure rehabilitative services following TAVR. This study had several key findings: First, we found that more than 25% of TAVR patients were discharged to a rehabilitation facility, and majority (almost 90%) of them had presented for their procedure from home. Second, although the proportion of patients transferred from another health care facility was small, these patients experienced 4.3-fold higher odds of disposition to a rehabilitation facility following TAVR. Additionally, weekend admission and emergent admission were independently associated with need for rehabilitative services after discharge, regardless of academic practice type or patient comorbidities. These findings emphasize the need to further dissect reasons for patient transfers using a multi-disciplinary approach in order to improve overall patient triage and transitions of care.
Understanding pre-hospital drivers for post-TAVR disposition to a rehabilitation facility are relevant both clinically and economically in the context of readmission. This is because disposition to SNF and prolonged LOS have been found to be associated with increased risk of 30-day readmissions after TAVR [4]. Not surprisingly, our study demonstrated that longer hospitalization was associated with higher risk of discharge to a rehabilitation facility. This finding is in accordance with prior work that has shown that patients with longer intensive care unit stays were more likely to be discharged to an acute care facility versus home [9]. While the reasons for prolonged hospitalization may be multifactorial, they likely represent a combination of patient comorbidity burden or surgical complexity. With the utilization of TAVR likely to expand, we suspect that hospital LOS, in addition to readmission rates, will continue to improve with increasing experience. Nonetheless, these metrics will likely serve as an important benchmark with which to assess hospital performance and to promote value-based, high-quality care especially in the current era of episode-based payments.
What is further alarming is that existing rates of readmission following TAVR are still already high despite contemporary improves in valve design, delivery methods and training. According to one study, 24.4% of patients undergo TAVR tend to be re-hospitalized once and 12.5% are re-hospitalized twice within a year post procedure [18]. Other studies have reported even higher rates of 1-year post-TAVR readmission (43.9%), with 14.6% of those readmissions occurring within the first 30 days [7]. For patients undergoing TAVR, who are likely to be medically complex and potentially frail by current eligibility criteria, repeat readmission may not only indicate poor medical prognosis but also arguably represent a poor post-procedure quality of life. Thus, granular assessments of these metrics are integral for quality improvement, cost savings and reduction in preventable readmissions.
In our cohort, non-elective or weekend admissions were also found to be strongly associated with increased discharge to a rehabilitation facility. These patients may represent a high-risk cohort with either more advanced, debilitating disease or poor access that limited their ability to present for management of their disease in an elective fashion. We also found that patients transferred in from an acute care hospital were more likely to be admitted over the weekend and less likely to be admitted electively versus those admitted from home. These patients had a higher prevalence of renal failure and anemia, which further underscores their medical complexity. However, these patient characteristics did not remain statistically significant in our multivariable analysis, and which may likely be due to the small sample size. While prior studies have suggested significant regional variability in discharge from hospitals to SNFs [9], overall it seems reasonable that more medically complex patients requiring emergent or weekend transfer would be at an increased risk for discharge to a rehabilitation center.
While our findings enlighten the implications of contemporary trends in patient disposition, we propose that they can also be implemented to improve the current healthcare landscape. Notably, our finding that patients who were admitted on the weekend and emergently were more likely to be discharged to rehabilitation centers suggests a need to minimize these types of admissions. Although cardiac emergencies necessitating admission for TAVR cannot be eliminated, consideration for earlier transfer for these patients could have presented opportunities for the inpatient teams to circumvent or better optimize the patient for a procedure such that his or her risk of discharge to a rehabilitation facility is as low as possible. Moreover, as cardiac emergencies cannot be eliminated, consideration should be given to policies that would permit removing emergent admissions from analyses for reimbursement. This would ensure that institutions considered transfer hubs, capable of caring for patients in crisis requiring emergent TAVR, are not penalized based upon the patient’s discharge disposition or readmission course. These strategies could also be an incentive to improve overall inpatient prognostication, risk stratification, pre-procedure counseling and discharge planning.
Our findings can be placed in the context of existing Medicare PACT policies and their implications on hospital reimbursements. The CMS reduces hospital reimbursements when patients are sent to post-acute care settings earlier than national averages. Hospitals have been quoted to lose between $500,000- $700,000 in annual revenue, a figure that exceeds the average loss from more publicized pay-for-performance initiatives such as the Hospital Readmissions Reduction Program [19]. Though TAVR does not fall under these specific metrics yet, we suspect that its growth due to widespread adoption and increasing disposition tendency to rehabilitation may likely drive subsequent inclusion in the years ahead. Based on our findings, we recommend establishing care standards for transferred patients following TAVR that maximize home discharge, without compromising on the quality of care delivered.
This study is not without limitations. The NIS uses hospital claims data that are prone to inconsistency with regard to variability in coding practices between institutions. While the database captures patient disposition location, we are unable to assess post-discharge outcomes including readmissions. The NIS also precludes detailed assessment of patient presentation, procedural details, surgical risk (e.g. STS score), and frailty, all of which may have contributed to decisions regarding transfer and disposition. While indirect measures such as the Charlson comorbidity index and summation of Elixhauser comorbidities were evaluated, frailty itself was not formally assessed. It was also impossible to ascertain the exact rationale that led directly to disposition decision making.
In conclusion, this is the first study to specifically examine the impact of pre-hospitalization origin on patient’s use of rehabilitation services following TAVR. Admission origin appears to impact the likelihood for discharge to a rehabilitation facility post TAVR, independent of institution type and patient comorbidities. Drivers propagating non-home discharge, such as weekend transfers from non-acute facilities and non-elective cases, should be further investigated. These results stand to decrease hospital resource utilization under current PACT policies, improve risk assessments, and inform pre-procedure counseling, which may ultimately enhance overall patient care.
REFERENCES
- Leon MB, Smith CR, Mack M, et al. (2010) Transcatheter aortic-valve implantation for aortic stenosis in patients who cannot undergo surgery. N Engl J Med 363(17): 1597-1607.
- Leon MB, Smith CR, Mack MJ, et al. (2016) Transcatheter or Surgical Aortic-Valve Replacement in Intermediate-Risk Patients. The New England journal of medicine 374(17): 1609-1620.
- Smith CR, Leon MB, Mack MJ, et al. (2011) Transcatheter versus surgical aortic-valve replacement in high-risk patients. The New England journal of medicine 364(23): 2187-2198.
- Kolte D, Khera S, Sardar MR, et al.( 2017) Thirty-Day Readmissions After Transcatheter Aortic Valve Replacement in the United States: Insights From the Nationwide Readmissions Database. Circ Cardiovasc Interv 10(1).
- Forcillo J, Condado JF, Binongo JN, et al.(2017) Readmission rates after transcatheter aortic valve replacement in high- and extreme-risk patients with severe aortic stenosis. The Journal of thoracic and cardiovascular surgery 154(2): 445-452.
- Panaich SS, Arora S, Patel N, et al.(2016) Etiologies and Predictors of 30-Day Readmission and In-Hospital Mortality During Primary and Readmission After Transcatheter Aortic Valve Implantation. The American journal of cardiology 118(11): 1705-1711.
- Nombela-Franco L, del Trigo M, Morrison-Polo G, et al.(2015) Incidence, Causes, and Predictors of Early (</=30 Days) and Late Unplanned Hospital Readmissions After Transcatheter Aortic Valve Replacement. JACC Cardiovasc Interv 8(13): 1748-1757.
- Kleiman NS. (2017) In Touch But Out of Time: Aggressive Hospital Discharge and Readmissions After Transcatheter Aortic Valve Replacement. J Am Heart Assoc 6(8).
- Dodson JA, Williams MR, Cohen DJ, et al. (2017) Hospital Practice of Direct-Home Discharge and 30-Day Readmission After Transcatheter Aortic Valve Replacement in the Society of Thoracic Surgeons/American College of Cardiology Transcatheter Valve Therapy (STS/ACC TVT) Registry. J Am Heart Assoc 6(8).
- Zanettini R, Gatto G, Mori I, et al. (2014) Cardiac rehabilitation and mid-term follow-up after transcatheter aortic valve implantation. J Geriatr Cardiol 11(4): 279-285.
- HCUP NIS Description of Data Elements. Agency for Healthcare Research and Quality; 2008. www.hcup-us.ahrq.gov/db/vars/h_bedsz/nisnote.jsp. Accessed January 2017.
- Elixhauser A, Steiner C, Harris DR, Coffey RM. (1998) Comorbidity measures for use with administrative data. Medical care 36(1): 8-27.
- Moore BJ, White S, Washington R, Coenen N, Elixhauser A. (2017) Identifying Increased Risk of Readmission and In-hospital Mortality Using Hospital Administrative Data: The AHRQ Elixhauser Comorbidity Index. Medical care 55(7): 698-705.
- Charlson M, Szatrowski TP, Peterson J, Gold J.( 1994) Validation of a combined comorbidity index. J Clin Epidemiol 47(11): 1245-1251.
- Khera R, Angraal S, Couch T, et al.( 2017) Adherence to Methodological Standards in Research Using the National Inpatient Sample. Jama 318(20): 2011-2018.
- Shah RM, Zhang Q, Chatterjee S, et al.( 2018) Incidence, Cost, and Risk Factors for Readmission after Coronary Artery Bypass Grafting. The Annals of thoracic surgery. 107(6): 1782-1789.
- (HCUP) HCaUP. Cost-to-Charge Ratio Files: User Guide for Nationwide Readmissions Database (NIS) CCRs. 2018.
- Holmes DR, Jr., Brennan JM, Rumsfeld JS, et al. (2015) Clinical outcomes at 1 year following transcatheter aortic valve replacement. JAMA : the journal of the American Medical Association 313(10): 1019-1028.
- Fontana E, Navarro L. (2017) Why Medicare's PACT policy may cost you more than P4P. In. At the Margins: Advisory Board.
Copyright: Kaneko T, et al. ©2019. This is an open-access article distributed under the terms of the Creative Commons Attribution License, which permits unrestricted use, distribution, and reproduction in any medium, provided the original author and source are credited.
Citation: Kaneko T (2019). Outside Facility Transfer Is Associated With Frequent Disposition to Rehabilitation Following Transcatheter Aortic Valve Replacement. Cardiac 1(1): 6.